| 1. INTRODUCTION |
| 1.1. REPORT DESCRIPTION |
| 1.2. RESEARCH METHODOLOGY |
| 1.3.1. SECONDARY RESEARCH |
| 1.3.2. DATA ANALYSIS STAGES |
| 1.3.3. MARKET DATA FORECAST |
| 1.3.4. DATA TRIANGULATION AND ESTIMATION |
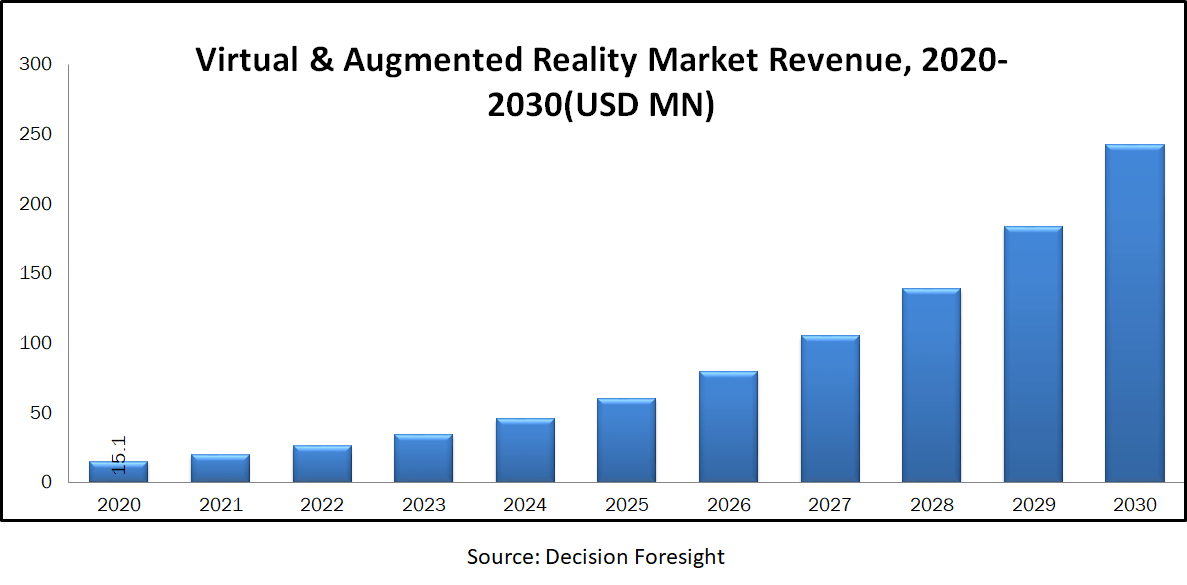
| 1.3.5. MARKET SNAPSHOT,2020-2030 MILLION USD |
| 2. Virtual & Augmented Reality - EXECUTIVE SUMMARY |
| 2.1 MARKET SNAPSHOT, 2020-2032, MILLION USD |
| 3. MACROECONOMIC INDICATORS, 2020-2032 |
| 4. PORTER’S FIVE FORCE MODEL ANALYSIS |
| 4.1. BARGAINING POWER OF SUPPLIERS |
| 4.2. THREAT OF SUBSTITUTES |
| 4.3. BARGAINING POWER OF SUPPLIERS |
| 4.4. THREAT OF NEW ENTRANTS |
| 4.5. DEGREE OF COMPETITION |
| 5. VALUE CHAIN ANALYSIS |
| 6. PRICING ANALYSIS |
| 7. COVID IMPACT ANALYSIS |
| 8. PESTEL ANALYSIS |
| 9. MARKET DYNAMICS |
| 9.1. GROWTH DRIVERS |
| 9.1.1. DRIVER 1 |
| 9.1.2. DRIVER 2 |
| 9.1.3. DRIVER 3 |
| 9.1.4. DRIVER 4 |
| 9.2. RESTRAINS |
| 9.2.1. RESTRAIN 1 |
| 9.2.2. RESTRAIN 2 |
| 9.3. OPPORTUNITIES |
| 9.3.1. OPPORTUNITY 1 |
| 9.3.2. OPPORTUNITY 2 |
| 9.4. CHALLENGE |
| 9.4.1. CHALLENGE 1 |
| 9.4.2. CHALLENGE 2 |
| 10. Global Virtual & Augmented Reality Market, By Product |
| 10.1. OVERVIEW |
| 10.2. Software & Applications |
| 10.2.2. Software & Applications Market, By Region |
| 10.2.2.1. North America Software & Applications Market, By Country (USD MILLION) |
| 10.2.2.2. Europe Software & Applications Market, By Country (USD MILLION) |
| 10.2.2.3. APAC Software & Applications Market, By Country (USD MILLION) |
| 10.2.2.4. LAMEA Software & Applications Market, By Country (USD MILLION) |
| 10.3. Sensors |
| 10.3.2. Sensors Market, By Region |
| 10.3.2.1. North America Sensors Market, By Country (USD MILLION) |
| 10.3.2.2. Europe Sensors Market, By Country (USD MILLION) |
| 10.3.2.3. APAC Sensors Market, By Country (USD MILLION) |
| 10.3.2.4. LAMEA Sensors Market, By Country (USD MILLION) |
| 10.4. Semiconductor Components |
| 10.4.2. Semiconductor Components Market, By Region |
| 10.4.2.1. North America Semiconductor Components Market, By Country (USD MILLION) |
| 10.4.2.2. Europe Semiconductor Components Market, By Country (USD MILLION) |
| 10.4.2.3. APAC Semiconductor Components Market, By Country (USD MILLION) |
| 10.4.2.4. LAMEA Semiconductor Components Market, By Country (USD MILLION) |
| 10.5. Display and Projector |
| 10.5.2. Display and Projector Market, By Region |
| 10.5.2.1. North America Display and Projector Market, By Country (USD MILLION) |
| 10.5.2.2. Europe Display and Projector Market, By Country (USD MILLION) |
| 10.5.2.3. APAC Display and Projector Market, By Country (USD MILLION) |
| 10.5.2.4. LAMEA Display and Projector Market, By Country (USD MILLION) |
| 10.6. Position Tracker |
| 10.6.2. Position Tracker Market, By Region |
| 10.6.2.1. North America Position Tracker Market, By Country (USD MILLION) |
| 10.6.2.2. Europe Position Tracker Market, By Country (USD MILLION) |
| 10.6.2.3. APAC Position Tracker Market, By Country (USD MILLION) |
| 10.6.2.4. LAMEA Position Tracker Market, By Country (USD MILLION) |
| 10.7. Camera |
| 10.7.2. Camera Market, By Region |
| 10.7.2.1. North America Camera Market, By Country (USD MILLION) |
| 10.7.2.2. Europe Camera Market, By Country (USD MILLION) |
| 10.7.2.3. APAC Camera Market, By Country (USD MILLION) |
| 10.7.2.4. LAMEA Camera Market, By Country (USD MILLION) |
| 11. Global Virtual & Augmented Reality Market, By Technology |
| 11.1. OVERVIEW |
| 11.2. Augmented Reality (AR) |
| 11.2.1. GLOBAL Augmented Reality (AR) Market, By Technology |
| 11.2.1.1. Marker-based Augmented Reality Market, By Region |
| 11.2.1.1.1. North America Marker-based Augmented Reality Market, By Country (USD MILLION) |
| 11.2.1.1.2. Europe Marker-based Augmented Reality Market, By Country (USD MILLION) |
| 11.2.1.1.3. APAC Marker-based Augmented Reality Market, By Country (USD MILLION) |
| 11.2.1.1.4. LAMEA Marker-based Augmented Reality Market, By Country (USD MILLION) |
| 11.2.1.1. Markerless Augmented Reality Market, By Region |
| 11.2.1.1.1. North America Markerless Augmented Reality Market, By Country (USD MILLION) |
| 11.2.1.1.2. Europe Markerless Augmented Reality Market, By Country (USD MILLION) |
| 11.2.1.1.3. APAC Markerless Augmented Reality Market, By Country (USD MILLION) |
| 11.2.1.1.4. LAMEA Markerless Augmented Reality Market, By Country (USD MILLION) |
| 11.2.2. Augmented Reality (AR) Market, By Region |
| 11.2.2.1. North America Augmented Reality (AR) Market, By Country (USD MILLION) |
| 11.2.2.2. Europe Augmented Reality (AR) Market, By Country (USD MILLION) |
| 11.2.2.3. APAC Augmented Reality (AR) Market, By Country (USD MILLION) |
| 11.2.2.4. LAMEA Augmented Reality (AR) Market, By Country (USD MILLION) |
| 11.3. Virtual Reality (VR) |
| 11.3.1. GLOBAL Virtual Reality (VR) Market, By Technology |
| 11.3.1.1. Non-Immersive Technology Market, By Region |
| 11.3.1.1.1. North America Non-Immersive Technology Market, By Country (USD MILLION) |
| 11.3.1.1.2. Europe Non-Immersive Technology Market, By Country (USD MILLION) |
| 11.3.1.1.3. APAC Non-Immersive Technology Market, By Country (USD MILLION) |
| 11.3.1.1.4. LAMEA Non-Immersive Technology Market, By Country (USD MILLION) |
| 11.3.1.1. semi-immersive Market, By Region |
| 11.3.1.1.1. North America semi-immersive Market, By Country (USD MILLION) |
| 11.3.1.1.2. Europe semi-immersive Market, By Country (USD MILLION) |
| 11.3.1.1.3. APAC semi-immersive Market, By Country (USD MILLION) |
| 11.3.1.1.4. LAMEA semi-immersive Market, By Country (USD MILLION) |
| 11.3.1.1. fully immersive technology Market, By Region |
| 11.3.1.1.1. North America fully immersive technology Market, By Country (USD MILLION) |
| 11.3.1.1.2. Europe fully immersive technology Market, By Country (USD MILLION) |
| 11.3.1.1.3. APAC fully immersive technology Market, By Country (USD MILLION) |
| 11.3.1.1.4. LAMEA fully immersive technology Market, By Country (USD MILLION) |
| 11.3.2. Virtual Reality (VR) Market, By Region |
| 11.3.2.1. North America Virtual Reality (VR) Market, By Country (USD MILLION) |
| 11.3.2.2. Europe Virtual Reality (VR) Market, By Country (USD MILLION) |
| 11.3.2.3. APAC Virtual Reality (VR) Market, By Country (USD MILLION) |
| 11.3.2.4. LAMEA Virtual Reality (VR) Market, By Country (USD MILLION) |
| 12. Global Virtual & Augmented Reality Market, By End-User |
| 12.1. OVERVIEW |
| 12.2. Gaming |
| 12.2.2. Gaming Market, By Region |
| 12.2.2.1. North America Gaming Market, By Country (USD MILLION) |
| 12.2.2.2. Europe Gaming Market, By Country (USD MILLION) |
| 12.2.2.3. APAC Gaming Market, By Country (USD MILLION) |
| 12.2.2.4. LAMEA Gaming Market, By Country (USD MILLION) |
| 12.3. Entertainment and Media |
| 12.3.2. Entertainment and Media Market, By Region |
| 12.3.2.1. North America Entertainment and Media Market, By Country (USD MILLION) |
| 12.3.2.2. Europe Entertainment and Media Market, By Country (USD MILLION) |
| 12.3.2.3. APAC Entertainment and Media Market, By Country (USD MILLION) |
| 12.3.2.4. LAMEA Entertainment and Media Market, By Country (USD MILLION) |
| 12.4. Aerospace and Defence |
| 12.4.2. Aerospace and Defence Market, By Region |
| 12.4.2.1. North America Aerospace and Defence Market, By Country (USD MILLION) |
| 12.4.2.2. Europe Aerospace and Defence Market, By Country (USD MILLION) |
| 12.4.2.3. APAC Aerospace and Defence Market, By Country (USD MILLION) |
| 12.4.2.4. LAMEA Aerospace and Defence Market, By Country (USD MILLION) |
| 12.5. Healthcare |
| 12.5.2. Healthcare Market, By Region |
| 12.5.2.1. North America Healthcare Market, By Country (USD MILLION) |
| 12.5.2.2. Europe Healthcare Market, By Country (USD MILLION) |
| 12.5.2.3. APAC Healthcare Market, By Country (USD MILLION) |
| 12.5.2.4. LAMEA Healthcare Market, By Country (USD MILLION) |
| 12.6. Education |
| 12.6.2. Education Market, By Region |
| 12.6.2.1. North America Education Market, By Country (USD MILLION) |
| 12.6.2.2. Europe Education Market, By Country (USD MILLION) |
| 12.6.2.3. APAC Education Market, By Country (USD MILLION) |
| 12.6.2.4. LAMEA Education Market, By Country (USD MILLION) |
| 12.7. Manufacturing |
| 12.7.2. Manufacturing Market, By Region |
| 12.7.2.1. North America Manufacturing Market, By Country (USD MILLION) |
| 12.7.2.2. Europe Manufacturing Market, By Country (USD MILLION) |
| 12.7.2.3. APAC Manufacturing Market, By Country (USD MILLION) |
| 12.7.2.4. LAMEA Manufacturing Market, By Country (USD MILLION) |
| 12.8. Others |
| 12.8.2. Others Market, By Region |
| 12.8.2.1. North America Others Market, By Country (USD MILLION) |
| 12.8.2.2. Europe Others Market, By Country (USD MILLION) |
| 12.8.2.3. APAC Others Market, By Country (USD MILLION) |
| 12.8.2.4. LAMEA Others Market, By Country (USD MILLION) |
| 13. Global Virtual & Augmented Reality Market, By Region |
| 13.1. OVERVIEW |
| 13.2. North America |
| 13.2.1.North America Virtual & Augmented Reality Market, By Product |
| 13.2.2.North America Virtual & Augmented Reality Market, By Technology |
| 13.2.3.North America Virtual & Augmented Reality Market, By End-User |
| 13.2.4. North America Virtual & Augmented Reality Market, By Country |
| 13.2.4.1. U.S. |
| 13.2.4.1.1. U.S. Virtual & Augmented Reality Market, By Product (USD MILLION) |
| 13.2.4.1.2. U.S. Virtual & Augmented Reality Market, By Technology (USD MILLION) |
| 13.2.4.1.3. U.S. Virtual & Augmented Reality Market, By End-User (USD MILLION) |
| 13.2.4.2. Canada |
| 13.2.4.2.1. Canada Virtual & Augmented Reality Market, By Product (USD MILLION) |
| 13.2.4.2.2. Canada Virtual & Augmented Reality Market, By Technology (USD MILLION) |
| 13.2.4.2.3. Canada Virtual & Augmented Reality Market, By End-User (USD MILLION) |
| 13.2.4.3. Mexico |
| 13.2.4.3.1. Mexico Virtual & Augmented Reality Market, By Product (USD MILLION) |
| 13.2.4.3.2. Mexico Virtual & Augmented Reality Market, By Technology (USD MILLION) |
| 13.2.4.3.3. Mexico Virtual & Augmented Reality Market, By End-User (USD MILLION) |
| 13.3. Europe |
| 13.3.1.Europe Virtual & Augmented Reality Market, By Product |
| 13.3.2.Europe Virtual & Augmented Reality Market, By Technology |
| 13.3.3.Europe Virtual & Augmented Reality Market, By End-User |
| 13.3.4. Europe Virtual & Augmented Reality Market, By Country |
| 13.3.4.1. Germany |
| 13.3.4.1.1. Germany Virtual & Augmented Reality Market, By Product (USD MILLION) |
| 13.3.4.1.2. Germany Virtual & Augmented Reality Market, By Technology (USD MILLION) |
| 13.3.4.1.3. Germany Virtual & Augmented Reality Market, By End-User (USD MILLION) |
| 13.3.4.2. France |
| 13.3.4.2.1. France Virtual & Augmented Reality Market, By Product (USD MILLION) |
| 13.3.4.2.2. France Virtual & Augmented Reality Market, By Technology (USD MILLION) |
| 13.3.4.2.3. France Virtual & Augmented Reality Market, By End-User (USD MILLION) |
| 13.3.4.3. Italy |
| 13.3.4.3.1. Italy Virtual & Augmented Reality Market, By Product (USD MILLION) |
| 13.3.4.3.2. Italy Virtual & Augmented Reality Market, By Technology (USD MILLION) |
| 13.3.4.3.3. Italy Virtual & Augmented Reality Market, By End-User (USD MILLION) |
| 13.3.4.4. Spain |
| 13.3.4.4.1. Spain Virtual & Augmented Reality Market, By Product (USD MILLION) |
| 13.3.4.4.2. Spain Virtual & Augmented Reality Market, By Technology (USD MILLION) |
| 13.3.4.4.3. Spain Virtual & Augmented Reality Market, By End-User (USD MILLION) |
| 13.3.4.5. Netherlands |
| 13.3.4.5.1. Netherlands Virtual & Augmented Reality Market, By Product (USD MILLION) |
| 13.3.4.5.2. Netherlands Virtual & Augmented Reality Market, By Technology (USD MILLION) |
| 13.3.4.5.3. Netherlands Virtual & Augmented Reality Market, By End-User (USD MILLION) |
| 13.3.4.6. BENELUX |
| 13.3.4.6.1. BENELUX Virtual & Augmented Reality Market, By Product (USD MILLION) |
| 13.3.4.6.2. BENELUX Virtual & Augmented Reality Market, By Technology (USD MILLION) |
| 13.3.4.6.3. BENELUX Virtual & Augmented Reality Market, By End-User (USD MILLION) |
| 13.3.4.7. Turkey |
| 13.3.4.7.1. Turkey Virtual & Augmented Reality Market, By Product (USD MILLION) |
| 13.3.4.7.2. Turkey Virtual & Augmented Reality Market, By Technology (USD MILLION) |
| 13.3.4.7.3. Turkey Virtual & Augmented Reality Market, By End-User (USD MILLION) |
| 13.3.4.8. Russia |
| 13.3.4.8.1. Russia Virtual & Augmented Reality Market, By Product (USD MILLION) |
| 13.3.4.8.2. Russia Virtual & Augmented Reality Market, By Technology (USD MILLION) |
| 13.3.4.8.3. Russia Virtual & Augmented Reality Market, By End-User (USD MILLION) |
| 13.3.4.9. Poland |
| 13.3.4.9.1. Poland Virtual & Augmented Reality Market, By Product (USD MILLION) |
| 13.3.4.9.2. Poland Virtual & Augmented Reality Market, By Technology (USD MILLION) |
| 13.3.4.9.3. Poland Virtual & Augmented Reality Market, By End-User (USD MILLION) |
| 13.3.4.10. Rest of Europe |
| 13.3.4.10.1. Rest of Europe Virtual & Augmented Reality Market, By Product (USD MILLION) |
| 13.3.4.10.2. Rest of Europe Virtual & Augmented Reality Market, By Technology (USD MILLION) |
| 13.3.4.10.3. Rest of Europe Virtual & Augmented Reality Market, By End-User (USD MILLION) |
| 13.4. APAC |
| 13.4.1.APAC Virtual & Augmented Reality Market, By Product |
| 13.4.2.APAC Virtual & Augmented Reality Market, By Technology |
| 13.4.3.APAC Virtual & Augmented Reality Market, By End-User |
| 13.4.4. APAC Virtual & Augmented Reality Market, By Country |
| 13.4.4.1. Japan |
| 13.4.4.1.1. Japan Virtual & Augmented Reality Market, By Product (USD MILLION) |
| 13.4.4.1.2. Japan Virtual & Augmented Reality Market, By Technology (USD MILLION) |
| 13.4.4.1.3. Japan Virtual & Augmented Reality Market, By End-User (USD MILLION) |
| 13.4.4.2. Italy |
| 13.4.4.2.1. Italy Virtual & Augmented Reality Market, By Product (USD MILLION) |
| 13.4.4.2.2. Italy Virtual & Augmented Reality Market, By Technology (USD MILLION) |
| 13.4.4.2.3. Italy Virtual & Augmented Reality Market, By End-User (USD MILLION) |
| 13.4.4.3. India |
| 13.4.4.3.1. India Virtual & Augmented Reality Market, By Product (USD MILLION) |
| 13.4.4.3.2. India Virtual & Augmented Reality Market, By Technology (USD MILLION) |
| 13.4.4.3.3. India Virtual & Augmented Reality Market, By End-User (USD MILLION) |
| 13.4.4.4. South Korea |
| 13.4.4.4.1. South Korea Virtual & Augmented Reality Market, By Product (USD MILLION) |
| 13.4.4.4.2. South Korea Virtual & Augmented Reality Market, By Technology (USD MILLION) |
| 13.4.4.4.3. South Korea Virtual & Augmented Reality Market, By End-User (USD MILLION) |
| 13.4.4.5. Rest of APAC |
| 13.4.4.5.1. Rest of APAC Virtual & Augmented Reality Market, By Product (USD MILLION) |
| 13.4.4.5.2. Rest of APAC Virtual & Augmented Reality Market, By Technology (USD MILLION) |
| 13.4.4.5.3. Rest of APAC Virtual & Augmented Reality Market, By End-User (USD MILLION) |
| 13.5. LAMEA |
| 13.5.1.LAMEA Virtual & Augmented Reality Market, By Product |
| 13.5.2.LAMEA Virtual & Augmented Reality Market, By Technology |
| 13.5.3.LAMEA Virtual & Augmented Reality Market, By End-User |
| 13.5.4. LAMEA Virtual & Augmented Reality Market, By Country |
| 13.5.4.1. Brazil |
| 13.5.4.1.1. Brazil Virtual & Augmented Reality Market, By Product (USD MILLION) |
| 13.5.4.1.2. Brazil Virtual & Augmented Reality Market, By Technology (USD MILLION) |
| 13.5.4.1.3. Brazil Virtual & Augmented Reality Market, By End-User (USD MILLION) |
| 13.5.4.2. Turkey |
| 13.5.4.2.1. Turkey Virtual & Augmented Reality Market, By Product (USD MILLION) |
| 13.5.4.2.2. Turkey Virtual & Augmented Reality Market, By Technology (USD MILLION) |
| 13.5.4.2.3. Turkey Virtual & Augmented Reality Market, By End-User (USD MILLION) |
| 13.5.4.3. Saudi Arabia |
| 13.5.4.3.1. Saudi Arabia Virtual & Augmented Reality Market, By Product (USD MILLION) |
| 13.5.4.3.2. Saudi Arabia Virtual & Augmented Reality Market, By Technology (USD MILLION) |
| 13.5.4.3.3. Saudi Arabia Virtual & Augmented Reality Market, By End-User (USD MILLION) |
| 13.5.4.4. South Africa |
| 13.5.4.4.1. South Africa Virtual & Augmented Reality Market, By Product (USD MILLION) |
| 13.5.4.4.2. South Africa Virtual & Augmented Reality Market, By Technology (USD MILLION) |
| 13.5.4.4.3. South Africa Virtual & Augmented Reality Market, By End-User (USD MILLION) |
| 13.5.4.5. Rest of LAMEA |
| 13.5.4.5.1. Rest of LAMEA Virtual & Augmented Reality Market, By Product (USD MILLION) |
| 13.5.4.5.2. Rest of LAMEA Virtual & Augmented Reality Market, By Technology (USD MILLION) |
| 13.5.4.5.3. Rest of LAMEA Virtual & Augmented Reality Market, By End-User (USD MILLION) |
| 14. COMPANY PFOFILES |
| 14.1. Alphabet Inc. (U.S.) |
| 14.1.1. COMPANY OVERVIEW |
| 14.1.2. COMPANY SNAPSHOT |
| 14.1.3. OPERATING BUSINESS SEGMENTS |
| 14.1.4. PRODUCT PORTFOLIO |
| 14.1.5. BUSINESS PERFORMANCE |
| 14.1.6. KEY STRATEGIC MOVES AND DEVELOPMENT |
| 14.2. HP Inc. (Netherlands) |
| 14.2.1. COMPANY OVERVIEW |
| 14.2.2. COMPANY SNAPSHOT |
| 14.2.3. OPERATING BUSINESS SEGMENTS |
| 14.2.4. PRODUCT PORTFOLIO |
| 14.2.5. BUSINESS PERFORMANCE |
| 14.2.6. KEY STRATEGIC MOVES AND DEVELOPMENT |
| 14.3. Facebook (United States) |
| 14.3.1. COMPANY OVERVIEW |
| 14.3.2. COMPANY SNAPSHOT |
| 14.3.3. OPERATING BUSINESS SEGMENTS |
| 14.3.4. PRODUCT PORTFOLIO |
| 14.3.5. BUSINESS PERFORMANCE |
| 14.3.6. KEY STRATEGIC MOVES AND DEVELOPMENT |
| 14.4. HTC Corporation (Taiwan) |
| 14.4.1. COMPANY OVERVIEW |
| 14.4.2. COMPANY SNAPSHOT |
| 14.4.3. OPERATING BUSINESS SEGMENTS |
| 14.4.4. PRODUCT PORTFOLIO |
| 14.4.5. BUSINESS PERFORMANCE |
| 14.4.6. KEY STRATEGIC MOVES AND DEVELOPMENT |
| 14.5. Microsoft (United States) |
| 14.5.1. COMPANY OVERVIEW |
| 14.5.2. COMPANY SNAPSHOT |
| 14.5.3. OPERATING BUSINESS SEGMENTS |
| 14.5.4. PRODUCT PORTFOLIO |
| 14.5.5. BUSINESS PERFORMANCE |
| 14.5.6. KEY STRATEGIC MOVES AND DEVELOPMENT |
| 14.6. Samsung Electronics Co., Ltd. (South Korea) |
| 14.6.1. COMPANY OVERVIEW |
| 14.6.2. COMPANY SNAPSHOT |
| 14.6.3. OPERATING BUSINESS SEGMENTS |
| 14.6.4. PRODUCT PORTFOLIO |
| 14.6.5. BUSINESS PERFORMANCE |
| 14.6.6. KEY STRATEGIC MOVES AND DEVELOPMENT |
| 14.7. Sensics, Inc. (Melbourne, Australia) |
| 14.7.1. COMPANY OVERVIEW |
| 14.7.2. COMPANY SNAPSHOT |
| 14.7.3. OPERATING BUSINESS SEGMENTS |
| 14.7.4. PRODUCT PORTFOLIO |
| 14.7.5. BUSINESS PERFORMANCE |
| 14.7.6. KEY STRATEGIC MOVES AND DEVELOPMENT |
| 14.8. Sixense Enterprises, Inc. (United States) |
| 14.8.1. COMPANY OVERVIEW |
| 14.8.2. COMPANY SNAPSHOT |
| 14.8.3. OPERATING BUSINESS SEGMENTS |
| 14.8.4. PRODUCT PORTFOLIO |
| 14.8.5. BUSINESS PERFORMANCE |
| 14.8.6. KEY STRATEGIC MOVES AND DEVELOPMENT |
| 14.9. Ultraleap Ltd (United States) |
| 14.9.1. COMPANY OVERVIEW |
| 14.9.2. COMPANY SNAPSHOT |
| 14.9.3. OPERATING BUSINESS SEGMENTS |
| 14.9.4. PRODUCT PORTFOLIO |
| 14.9.5. BUSINESS PERFORMANCE |
| 14.9.6. KEY STRATEGIC MOVES AND DEVELOPMENT |