LIST OF TABLE
TABLE 1. Moderate to High Bargaining Power of Suppliers
TABLE 2. Moderate Bargaining Power of buyers
TABLE 3. Moderate threat of substitution
TABLE 4. Moderate to high threat of new entrants
TABLE 5. high to Moderate competitive rivalry
TABLE 6. Global Electronic Toll Collection Market Value, By Subsystem, 2020-2030, Million USD
TABLE 7. Automated Vehicle Identification Market Value, By Region, Million USD
TABLE 8. North America Automated Vehicle Identification Market Value, By Country, Million USD
TABLE 9. Europe Automated Vehicle Identification Market Value, By Country, Million USD
TABLE 10. Asia-Pacific Automated Vehicle Identification Market Value, By Country, Million USD
TABLE 11. Rest of World Automated Vehicle Identification Market Value, By Country, Million USD
TABLE 12. Automated Vehicle Classification Market Value, By Region, Million USD
TABLE 13. North America Automated Vehicle Classification Market Value, By Country, Million USD
TABLE 14. Europe Automated Vehicle Classification Market Value, By Country, Million USD
TABLE 15. Asia-Pacific Automated Vehicle Classification Market Value, By Country, Million USD
TABLE 16. Rest of World Automated Vehicle Classification Market Value, By Country, Million USD
TABLE 17. Violation Enforcement system (VES) Market Value, By Region, Million USD
TABLE 18. North America Violation Enforcement system (VES) Market Value, By Country, Million USD
TABLE 19. Europe Violation Enforcement system (VES) Market Value, By Country, Million USD
TABLE 20. Asia-Pacific Violation Enforcement system (VES) Market Value, By Country, Million USD
TABLE 21. Rest of World Violation Enforcement system (VES) Market Value, By Country, Million USD
TABLE 22. Transaction processing Market Value, By Region, Million USD
TABLE 23. North America Transaction processing Market Value, By Country, Million USD
TABLE 24. Europe Transaction processing Market Value, By Country, Million USD
TABLE 25. Asia-Pacific Transaction processing Market Value, By Country, Million USD
TABLE 26. Rest of World Transaction processing Market Value, By Country, Million USD
TABLE 27. Global Electronic Toll Collection Market Value, By Technology, 2020-2030, Million USD
TABLE 28. RFID Market Value, By Region, Million USD
TABLE 29. North America RFID Market Value, By Country, Million USD
TABLE 30. Europe RFID Market Value, By Country, Million USD
TABLE 31. Asia-Pacific RFID Market Value, By Country, Million USD
TABLE 32. Rest of World RFID Market Value, By Country, Million USD
TABLE 33. DSRC Market Value, By Region, Million USD
TABLE 34. North America DSRC Market Value, By Country, Million USD
TABLE 35. Europe DSRC Market Value, By Country, Million USD
TABLE 36. Asia-Pacific DSRC Market Value, By Country, Million USD
TABLE 37. Rest of World DSRC Market Value, By Country, Million USD
TABLE 38. Infrared Market Value, By Region, Million USD
TABLE 39. North America Infrared Market Value, By Country, Million USD
TABLE 40. Europe Infrared Market Value, By Country, Million USD
TABLE 41. Asia-Pacific Infrared Market Value, By Country, Million USD
TABLE 42. Rest of World Infrared Market Value, By Country, Million USD
TABLE 43. GNSS & GPS Market Value, By Region, Million USD
TABLE 44. North America GNSS & GPS Market Value, By Country, Million USD
TABLE 45. Europe GNSS & GPS Market Value, By Country, Million USD
TABLE 46. Asia-Pacific GNSS & GPS Market Value, By Country, Million USD
TABLE 47. Rest of World GNSS & GPS Market Value, By Country, Million USD
TABLE 48. Video analytics Market Value, By Region, Million USD
TABLE 49. North America Video analytics Market Value, By Country, Million USD
TABLE 50. Europe Video analytics Market Value, By Country, Million USD
TABLE 51. Asia-Pacific Video analytics Market Value, By Country, Million USD
TABLE 52. Rest of World Video analytics Market Value, By Country, Million USD
TABLE 53. Global Electronic Toll Collection Market Value, By Appication, 2020-2030, Million USD
TABLE 54. Urbans Market Value, By Region, Million USD
TABLE 55. North America Urbans Market Value, By Country, Million USD
TABLE 56. Europe Urbans Market Value, By Country, Million USD
TABLE 57. Asia-Pacific Urbans Market Value, By Country, Million USD
TABLE 58. Rest of World Urbans Market Value, By Country, Million USD
TABLE 59. Highways Market Value, By Region, Million USD
TABLE 60. North America Highways Market Value, By Country, Million USD
TABLE 61. Europe Highways Market Value, By Country, Million USD
TABLE 62. Asia-Pacific Highways Market Value, By Country, Million USD
TABLE 63. Rest of World Highways Market Value, By Country, Million USD
TABLE 64. Global Electronic Toll Collection Market Value, By Region, 2020-2030, Million USD
TABLE 65. North America Electronic Toll Collection Market Value, By Subsystem, 2020-2030, Million USD
TABLE 66. North America Electronic Toll Collection Market Value, By Technology, 2020-2030, Million USD
TABLE 67. North America Electronic Toll Collection Market Value, By Appication, 2020-2030, Million USD
TABLE 68. North America Electronic Toll Collection Market Value, By Country, 2020-2030, Million USD
TABLE 69. U.S. Electronic Toll Collection Market Value, By Subsystem, 2020-2030, Million USD
TABLE 70. U.S. Electronic Toll Collection Market Value, By Technology, 2020-2030, Million USD
TABLE 71. U.S. Electronic Toll Collection Market Value, By Appication, 2020-2030, Million USD
TABLE 72. Canada Electronic Toll Collection Market Value, By Subsystem, 2020-2030, Million USD
TABLE 73. Canada Electronic Toll Collection Market Value, By Technology, 2020-2030, Million USD
TABLE 74. Canada Electronic Toll Collection Market Value, By Appication, 2020-2030, Million USD
TABLE 75. Mexico Electronic Toll Collection Market Value, By Subsystem, 2020-2030, Million USD
TABLE 76. Mexico Electronic Toll Collection Market Value, By Technology, 2020-2030, Million USD
TABLE 77. Mexico Electronic Toll Collection Market Value, By Appication, 2020-2030, Million USD
TABLE 78. Europe Electronic Toll Collection Market Value, By Subsystem, 2020-2030, Million USD
TABLE 79. Europe Electronic Toll Collection Market Value, By Technology, 2020-2030, Million USD
TABLE 80. Europe Electronic Toll Collection Market Value, By Appication, 2020-2030, Million USD
TABLE 81. Europe Electronic Toll Collection Market Value, By Country, 2020-2030, Million USD
TABLE 82. UK Electronic Toll Collection Market Value, By Subsystem, 2020-2030, Million USD
TABLE 83. UK Electronic Toll Collection Market Value, By Technology, 2020-2030, Million USD
TABLE 84. UK Electronic Toll Collection Market Value, By Appication, 2020-2030, Million USD
TABLE 85. Germany Electronic Toll Collection Market Value, By Subsystem, 2020-2030, Million USD
TABLE 86. Germany Electronic Toll Collection Market Value, By Technology, 2020-2030, Million USD
TABLE 87. Germany Electronic Toll Collection Market Value, By Appication, 2020-2030, Million USD
TABLE 88. France Electronic Toll Collection Market Value, By Subsystem, 2020-2030, Million USD
TABLE 89. France Electronic Toll Collection Market Value, By Technology, 2020-2030, Million USD
TABLE 90. France Electronic Toll Collection Market Value, By Appication, 2020-2030, Million USD
TABLE 91. Italy Electronic Toll Collection Market Value, By Subsystem, 2020-2030, Million USD
TABLE 92. Italy Electronic Toll Collection Market Value, By Technology, 2020-2030, Million USD
TABLE 93. Italy Electronic Toll Collection Market Value, By Appication, 2020-2030, Million USD
TABLE 94. Rest of Europe Electronic Toll Collection Market Value, By Subsystem, 2020-2030, Million USD
TABLE 95. Rest of Europe Electronic Toll Collection Market Value, By Technology, 2020-2030, Million USD
TABLE 96. Rest of Europe Electronic Toll Collection Market Value, By Appication, 2020-2030, Million USD
TABLE 97. Asia-Pacific Electronic Toll Collection Market Value, By Subsystem, 2020-2030, Million USD
TABLE 98. Asia-Pacific Electronic Toll Collection Market Value, By Technology, 2020-2030, Million USD
TABLE 99. Asia-Pacific Electronic Toll Collection Market Value, By Appication, 2020-2030, Million USD
TABLE 100. Asia-Pacific Electronic Toll Collection Market Value, By Country, 2020-2030, Million USD
TABLE 101. China Electronic Toll Collection Market Value, By Subsystem, 2020-2030, Million USD
TABLE 102. China Electronic Toll Collection Market Value, By Technology, 2020-2030, Million USD
TABLE 103. China Electronic Toll Collection Market Value, By Appication, 2020-2030, Million USD
TABLE 104. Japan Electronic Toll Collection Market Value, By Subsystem, 2020-2030, Million USD
TABLE 105. Japan Electronic Toll Collection Market Value, By Technology, 2020-2030, Million USD
TABLE 106. Japan Electronic Toll Collection Market Value, By Appication, 2020-2030, Million USD
TABLE 107. India Electronic Toll Collection Market Value, By Subsystem, 2020-2030, Million USD
TABLE 108. India Electronic Toll Collection Market Value, By Technology, 2020-2030, Million USD
TABLE 109. India Electronic Toll Collection Market Value, By Appication, 2020-2030, Million USD
TABLE 110. Australia Electronic Toll Collection Market Value, By Subsystem, 2020-2030, Million USD
TABLE 111. Australia Electronic Toll Collection Market Value, By Technology, 2020-2030, Million USD
TABLE 112. Australia Electronic Toll Collection Market Value, By Appication, 2020-2030, Million USD
TABLE 113. Rest of Asia-Pacific Electronic Toll Collection Market Value, By Subsystem, 2020-2030, Million USD
TABLE 114. Rest of Asia-Pacific Electronic Toll Collection Market Value, By Technology, 2020-2030, Million USD
TABLE 115. Rest of Asia-Pacific Electronic Toll Collection Market Value, By Appication, 2020-2030, Million USD
TABLE 116. Rest of World Electronic Toll Collection Market Value, By Subsystem, 2020-2030, Million USD
TABLE 117. Rest of World Electronic Toll Collection Market Value, By Technology, 2020-2030, Million USD
TABLE 118. Rest of World Electronic Toll Collection Market Value, By Appication, 2020-2030, Million USD
TABLE 119. Rest of World Electronic Toll Collection Market Value, By Country, 2020-2030, Million USD
TABLE 120. Latin America Electronic Toll Collection Market Value, By Subsystem, 2020-2030, Million USD
TABLE 121. Latin America Electronic Toll Collection Market Value, By Technology, 2020-2030, Million USD
TABLE 122. Latin America Electronic Toll Collection Market Value, By Appication, 2020-2030, Million USD
TABLE 123. Middle East Electronic Toll Collection Market Value, By Subsystem, 2020-2030, Million USD
TABLE 124. Middle East Electronic Toll Collection Market Value, By Technology, 2020-2030, Million USD
TABLE 125. Middle East Electronic Toll Collection Market Value, By Appication, 2020-2030, Million USD
TABLE 126. Africa Electronic Toll Collection Market Value, By Subsystem, 2020-2030, Million USD
TABLE 127. Africa Electronic Toll Collection Market Value, By Technology, 2020-2030, Million USD
TABLE 128. Africa Electronic Toll Collection Market Value, By Appication, 2020-2030, Million USD
TABLE 129. Toshiba Corporation: company Snapshot
TABLE 130. Toshiba Corporation: Operating segments
TABLE 131. Toshiba Corporation: Operating segments
TABLE 132. Raytheon: company Snapshot
TABLE 133. Raytheon: Operating segments
TABLE 134. Raytheon: Operating segments
TABLE 135. Thales: company Snapshot
TABLE 136. Thales: Operating segments
TABLE 137. Siemens AG: company Snapshot
TABLE 138. Siemens AG: Operating segments
TABLE 139. Siemens AG: Operating segments
TABLE 140. Kapsch: company Snapshot
TABLE 141. Kapsch: Operating segments
TABLE 142. Kapsch: Operating segments
TABLE 143. Conduent (Xerox Corporation): company Snapshot
TABLE 144. MAGNAX: Operating segments
TABLE 145. Cubic Transportation: company Snapshot
TABLE 146. Cubic Transportation: Operating segments
TABLE 147. Cubic Transportation: Operating segments
TABLE 148. Transcore (Roper Technologies): company Snapshot
TABLE 149. Transcore (Roper Technologies): Operating segments
TABLE 150. Transcore (Roper Technologies): Operating segments
TABLE 151. Perceptics: company Snapshot
TABLE 152. Perceptics: Operating segments
TABLE 153. EFKON GMBH: company Snapshot
TABLE 154. EFKON GMBH: Operating segments
TABLE 155. EFKON GMBH: Operating segments
LIST OF FIGURES
FIGURE 1. Global Electronic Toll Collection Market Value, By Subsystem, 2020-2030, Million USD
FIGURE 2. Automated Vehicle Identification Market Value, By Region, Million USD
FIGURE 3. North America Automated Vehicle Identification Market Value, By Country, Million USD
FIGURE 4. Europe Automated Vehicle Identification Market Value, By Country, Million USD
FIGURE 5. Asia-Pacific Automated Vehicle Identification Market Value, By Country, Million USD
FIGURE 6. Rest of World Automated Vehicle Identification Market Value, By Country, Million USD
FIGURE 7. Automated Vehicle Classification Market Value, By Region, Million USD
FIGURE 8. North America Automated Vehicle Classification Market Value, By Country, Million USD
FIGURE 9. Europe Automated Vehicle Classification Market Value, By Country, Million USD
FIGURE 10. Asia-Pacific Automated Vehicle Classification Market Value, By Country, Million USD
FIGURE 11. Rest of World Automated Vehicle Classification Market Value, By Country, Million USD
FIGURE 12. Violation Enforcement system (VES) Market Value, By Region, Million USD
FIGURE 13. North America Violation Enforcement system (VES) Market Value, By Country, Million USD
FIGURE 14. Europe Violation Enforcement system (VES) Market Value, By Country, Million USD
FIGURE 15. Asia-Pacific Violation Enforcement system (VES) Market Value, By Country, Million USD
FIGURE 16. Rest of World Violation Enforcement system (VES) Market Value, By Country, Million USD
FIGURE 17. Transaction processing Market Value, By Region, Million USD
FIGURE 18. North America Transaction processing Market Value, By Country, Million USD
FIGURE 19. Europe Transaction processing Market Value, By Country, Million USD
FIGURE 20. Asia-Pacific Transaction processing Market Value, By Country, Million USD
FIGURE 21. Rest of World Transaction processing Market Value, By Country, Million USD
FIGURE 22. Global Electronic Toll Collection Market Value, By Technology, 2020-2030, Million USD
FIGURE 23. RFID Market Value, By Region, Million USD
FIGURE 24. North America RFID Market Value, By Country, Million USD
FIGURE 25. Europe RFID Market Value, By Country, Million USD
FIGURE 26. Asia-Pacific RFID Market Value, By Country, Million USD
FIGURE 27. Rest of World RFID Market Value, By Country, Million USD
FIGURE 28. DSRC Market Value, By Region, Million USD
FIGURE 29. North America DSRC Market Value, By Country, Million USD
FIGURE 30. Europe DSRC Market Value, By Country, Million USD
FIGURE 31. Asia-Pacific DSRC Market Value, By Country, Million USD
FIGURE 32. Rest of World DSRC Market Value, By Country, Million USD
FIGURE 33. Infrared Market Value, By Region, Million USD
FIGURE 34. North America Infrared Market Value, By Country, Million USD
FIGURE 35. Europe Infrared Market Value, By Country, Million USD
FIGURE 36. Asia-Pacific Infrared Market Value, By Country, Million USD
FIGURE 37. Rest of World Infrared Market Value, By Country, Million USD
FIGURE 38. GNSS & GPS Market Value, By Region, Million USD
FIGURE 39. North America GNSS & GPS Market Value, By Country, Million USD
FIGURE 40. Europe GNSS & GPS Market Value, By Country, Million USD
FIGURE 41. Asia-Pacific GNSS & GPS Market Value, By Country, Million USD
FIGURE 42. Rest of World GNSS & GPS Market Value, By Country, Million USD
FIGURE 43. Video analytics Market Value, By Region, Million USD
FIGURE 44. North America Video analytics Market Value, By Country, Million USD
FIGURE 45. Europe Video analytics Market Value, By Country, Million USD
FIGURE 46. Asia-Pacific Video analytics Market Value, By Country, Million USD
FIGURE 47. Rest of World Video analytics Market Value, By Country, Million USD
FIGURE 48. Global Electronic Toll Collection Market Value, By Appication, 2020-2030, Million USD
FIGURE 49. Urbans Market Value, By Region, Million USD
FIGURE 50. North America Urbans Market Value, By Country, Million USD
FIGURE 51. Europe Urbans Market Value, By Country, Million USD
FIGURE 52. Asia-Pacific Urbans Market Value, By Country, Million USD
FIGURE 53. Rest of World Urbans Market Value, By Country, Million USD
FIGURE 54. Highways Market Value, By Region, Million USD
FIGURE 55. North America Highways Market Value, By Country, Million USD
FIGURE 56. Europe Highways Market Value, By Country, Million USD
FIGURE 57. Asia-Pacific Highways Market Value, By Country, Million USD
FIGURE 58. Rest of World Highways Market Value, By Country, Million USD
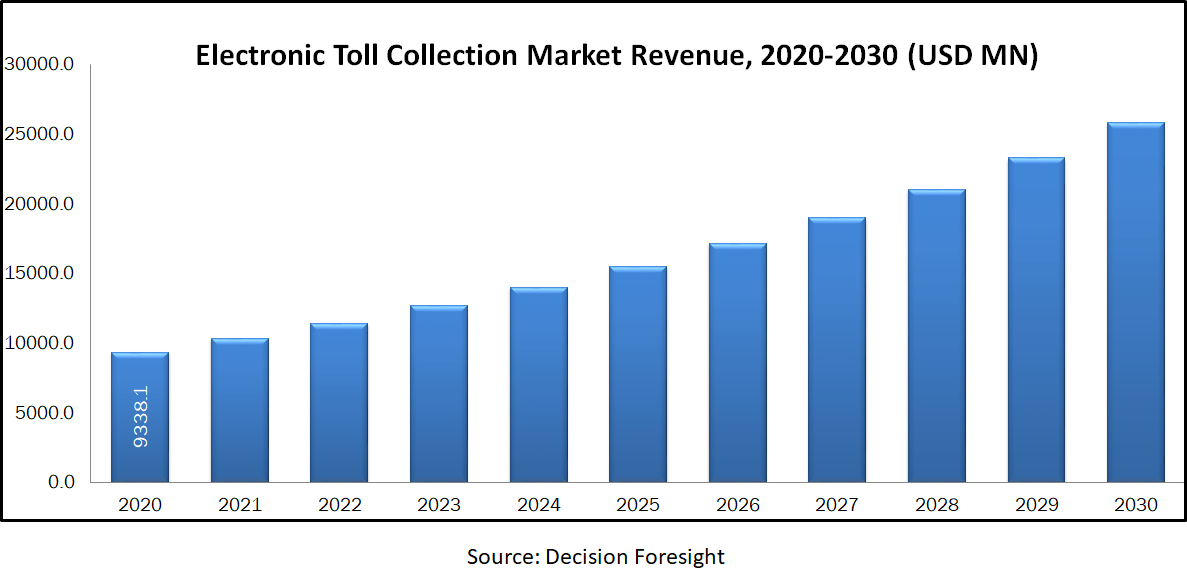
FIGURE 59. Global Electronic Toll Collection Market Value, By Region, 2020-2030, Million USD
FIGURE 60. North America Electronic Toll Collection Market Value, By Subsystem, 2020-2030, Million USD
FIGURE 61. North America Electronic Toll Collection Market Value, By Technology, 2020-2030, Million USD
FIGURE 62. North America Electronic Toll Collection Market Value, By Appication, 2020-2030, Million USD
FIGURE 63. North America Electronic Toll Collection Market Value, By Country, 2020-2030, Million USD
FIGURE 64. U.S. Electronic Toll Collection Market Value, By Subsystem, 2020-2030, Million USD
FIGURE 65. U.S. Electronic Toll Collection Market Value, By Technology, 2020-2030, Million USD
FIGURE 66. U.S. Electronic Toll Collection Market Value, By Appication, 2020-2030, Million USD
FIGURE 67. Canada Electronic Toll Collection Market Value, By Subsystem, 2020-2030, Million USD
FIGURE 68. Canada Electronic Toll Collection Market Value, By Technology, 2020-2030, Million USD
FIGURE 69. Canada Electronic Toll Collection Market Value, By Appication, 2020-2030, Million USD
FIGURE 70. Mexico Electronic Toll Collection Market Value, By Subsystem, 2020-2030, Million USD
FIGURE 71. Mexico Electronic Toll Collection Market Value, By Technology, 2020-2030, Million USD
FIGURE 72. Mexico Electronic Toll Collection Market Value, By Appication, 2020-2030, Million USD
FIGURE 73. Europe Electronic Toll Collection Market Value, By Subsystem, 2020-2030, Million USD
FIGURE 74. Europe Electronic Toll Collection Market Value, By Technology, 2020-2030, Million USD
FIGURE 75. Europe Electronic Toll Collection Market Value, By Appication, 2020-2030, Million USD
FIGURE 76. Europe Electronic Toll Collection Market Value, By Country, 2020-2030, Million USD
FIGURE 77. UK Electronic Toll Collection Market Value, By Subsystem, 2020-2030, Million USD
FIGURE 78. UK Electronic Toll Collection Market Value, By Technology, 2020-2030, Million USD
FIGURE 79. UK Electronic Toll Collection Market Value, By Appication, 2020-2030, Million USD
FIGURE 80. Germany Electronic Toll Collection Market Value, By Subsystem, 2020-2030, Million USD
FIGURE 81. Germany Electronic Toll Collection Market Value, By Technology, 2020-2030, Million USD
FIGURE 82. Germany Electronic Toll Collection Market Value, By Appication, 2020-2030, Million USD
FIGURE 83. France Electronic Toll Collection Market Value, By Subsystem, 2020-2030, Million USD
FIGURE 84. France Electronic Toll Collection Market Value, By Technology, 2020-2030, Million USD
FIGURE 85. France Electronic Toll Collection Market Value, By Appication, 2020-2030, Million USD
FIGURE 86. Italy Electronic Toll Collection Market Value, By Subsystem, 2020-2030, Million USD
FIGURE 87. Italy Electronic Toll Collection Market Value, By Technology, 2020-2030, Million USD
FIGURE 88. Italy Electronic Toll Collection Market Value, By Appication, 2020-2030, Million USD
FIGURE 89. Rest of Europe Electronic Toll Collection Market Value, By Subsystem, 2020-2030, Million USD
FIGURE 90. Rest of Europe Electronic Toll Collection Market Value, By Technology, 2020-2030, Million USD
FIGURE 91. Rest of Europe Electronic Toll Collection Market Value, By Appication, 2020-2030, Million USD
FIGURE 92. Asia-Pacific Electronic Toll Collection Market Value, By Subsystem, 2020-2030, Million USD
FIGURE 93. Asia-Pacific Electronic Toll Collection Market Value, By Technology, 2020-2030, Million USD
FIGURE 94. Asia-Pacific Electronic Toll Collection Market Value, By Appication, 2020-2030, Million USD
FIGURE 95. Asia-Pacific Electronic Toll Collection Market Value, By Country, 2020-2030, Million USD
FIGURE 96. China Electronic Toll Collection Market Value, By Subsystem, 2020-2030, Million USD
FIGURE 97. China Electronic Toll Collection Market Value, By Technology, 2020-2030, Million USD
FIGURE 98. China Electronic Toll Collection Market Value, By Appication, 2020-2030, Million USD
FIGURE 99. Japan Electronic Toll Collection Market Value, By Subsystem, 2020-2030, Million USD
FIGURE 100. Japan Electronic Toll Collection Market Value, By Technology, 2020-2030, Million USD
FIGURE 101. Japan Electronic Toll Collection Market Value, By Appication, 2020-2030, Million USD
FIGURE 102. India Electronic Toll Collection Market Value, By Subsystem, 2020-2030, Million USD
FIGURE 103. India Electronic Toll Collection Market Value, By Technology, 2020-2030, Million USD
FIGURE 104. India Electronic Toll Collection Market Value, By Appication, 2020-2030, Million USD
FIGURE 105. Australia Electronic Toll Collection Market Value, By Subsystem, 2020-2030, Million USD
FIGURE 106. Australia Electronic Toll Collection Market Value, By Technology, 2020-2030, Million USD
FIGURE 107. Australia Electronic Toll Collection Market Value, By Appication, 2020-2030, Million USD
FIGURE 108. Rest of Asia-Pacific Electronic Toll Collection Market Value, By Subsystem, 2020-2030, Million USD
FIGURE 109. Rest of Asia-Pacific Electronic Toll Collection Market Value, By Technology, 2020-2030, Million USD
FIGURE 110. Rest of Asia-Pacific Electronic Toll Collection Market Value, By Appication, 2020-2030, Million USD
FIGURE 111. Rest of World Electronic Toll Collection Market Value, By Subsystem, 2020-2030, Million USD
FIGURE 112. Rest of World Electronic Toll Collection Market Value, By Technology, 2020-2030, Million USD
FIGURE 113. Rest of World Electronic Toll Collection Market Value, By Appication, 2020-2030, Million USD
FIGURE 114. Rest of World Electronic Toll Collection Market Value, By Country, 2020-2030, Million USD
FIGURE 115. Latin America Electronic Toll Collection Market Value, By Subsystem, 2020-2030, Million USD
FIGURE 116. Latin America Electronic Toll Collection Market Value, By Technology, 2020-2030, Million USD
FIGURE 117. Latin America Electronic Toll Collection Market Value, By Appication, 2020-2030, Million USD
FIGURE 118. Middle East Electronic Toll Collection Market Value, By Subsystem, 2020-2030, Million USD
FIGURE 119. Middle East Electronic Toll Collection Market Value, By Technology, 2020-2030, Million USD
FIGURE 120. Middle East Electronic Toll Collection Market Value, By Appication, 2020-2030, Million USD
FIGURE 121. Africa Electronic Toll Collection Market Value, By Subsystem, 2020-2030, Million USD
FIGURE 122. Africa Electronic Toll Collection Market Value, By Technology, 2020-2030, Million USD
FIGURE 123. Africa Electronic Toll Collection Market Value, By Appication, 2020-2030, Million USD
FIGURE 124. Toshiba Corporation: NET SALES, 2015–2018 ($MILLION)
FIGURE 125. Raytheon: NET SALES, 2015–2018 ($MILLION)
FIGURE 126. Thales: NET SALES, 2015–2018 ($MILLION)
FIGURE 127. Siemens AG: NET SALES, 2015–2018 ($MILLION)
FIGURE 128. Kapsch: NET SALES, 2015–2018 ($MILLION)
FIGURE 129. Conduent (Xerox Corporation): NET SALES, 2015–2018 ($MILLION)
FIGURE 130. Cubic Transportation: NET SALES, 2015–2018 ($MILLION)
FIGURE 131. Transcore (Roper Technologies): NET SALES, 2015–2018 ($MILLION)