Breast Imaging Technologies Market - By Technology (Ionizing Breast Imaging Technologies (Mammography (Digital Mammography, 3D Mammogram, and Analog), MBI, PET-CT, PEM), Non-Ionizing Breast Imaging Technologies (Breast Ultrasound, Breast MRI, Automated Whole-Breast Ultrasound, and Breast Thermography)), By End User (Hospitals, Diagnostic Imaging Centers, and Ambulatory Surgical Centers), By Region - Global Opportunity Analysis and Industry Forecast, 2020 – 2030

DFS019987  | 
: Life Sciences & Healthcare  | 
Apr-2021  | 
Published  | 
Pages: 227  | 
Tables: 93  | 
Figures: 80
We’ve been tracking the direct impact of COVID-19 on this market, as well as the indirect impact from other industries. The report will incorporate these insights.


Breast Imaging Technologies market size was valued at USD 5250.9 million in 2020 and is expected to reach USD 11763 million by 2030, growing at a CAGR of 8.4% during the forecast period. Breast imaging is a subspecialty of diagnostic radiology. It includes a range of imaging procedures with variety of technologies to screen and tools for detection, and diagnoses breast cancer. If cancer is detected, these tests help the doctors to find the cancer type, as well as determine the stage and location of the cancer. This market is projected to witness significant growth during the forecast period due to increase in rate of breast cancer worldwide and practical initiatives by healthcare organizations to increase awareness about early breast cancer detection. These technologies are used to obtain high-resolution descriptions of breast tissues. These imaging modalities, such as ionizing and non-ionizing imaging technologies, aid in the early detection and diagnosis of breast diseases, especially breast cancer in women. Ionizing breast imaging modalities are widely adopted for the screening of breast cancer.  Breast cancer is the second most leading reason of death in women after cervical cancer. According to the estimates of GLOBOCAN, breast cancer is the most common form of cancer among women, with approximately 1.67 million new cancer cases diagnosed in 2012, and it is expected to affect more than 1.97 million individuals by 2020.

Market Segmentation:

On the basis of technology, the market is bifurcated into ionizing breast imaging technology and non-ionizing breast imaging technology. Ionizing technology further divided into mammography, MBI, PET-CT and PEM. Mammography further divided into Digital Mammography, 3D Mammogram, Analog. Non-ionizing technology classified into Breast Ultrasound, Breast MRI, Automated Whole-Breast Ultrasound, Breast Thermography. On the basis of end users, the market is segmented into hospitals, diagnostic imaging centers, and ambulatory surgical centers. Geographic breakdown and analysis of each of the aforesaid segments includes regions comprising North America, Europe, Asia-Pacific, and RoW.

Market Dynamics and Factors:

The launch of breast imaging technologies is essential to restrict the chances of breast cancer and its associated risk factors. Therefore, increase in frequency of breast cancer is estimated to increase the breast imaging technologies market share. Digital mammography is a specialized and advanced form of mammography that uses digital receptors and computers instead of X-ray films to examine breast tissue for the presence of tumors and the market is growing at CAGR 15.11% due to the many initiatives taken from the United States Preventive Services Task Force has developed guidelines for mammography screening. Furthermore, the National Cancer Institute conducts and facilitates many organizations to develop their guidelines. Healthcare organizations and governments around the world are taking initiatives to provide women, between the ages of 50 and 75, access to mammography screening. Additionally, the ability of these devices to create 3D images of the breast tissue, increases the detection rate of breast tumors, which also further contributed to their increased demand. In count, there have been a number of advancements in the field that prevent over-diagnosis and provide better sensitivity to detect smaller carcinomas. These continuous advancements in this field are anticipated to augment the mammography segment of global breast cancer screening tests market.  This remains a major driver for the mammography market and is expected to boost the market during the forecast period.

Geographic Analysis:

The number of cancer patients in North America has witnessed a considerable rise. Prostate and breast cancer are the most common forms of cancer in the region.  The United States will sustain a 6.1% growth force. Europe continue to remain an important element in the world economy demand in the region will come from the rest of the European markets. Asia Pacific is set to register remarkable growth during the forecast period on account of positive government initiatives to educate women regarding breast cancer and implementing effective diagnosis at primary healthcare centers. Middle East & Africa and Latin America serve as a profitable market for key players to promote business expansion through inorganic and organic market growth strategies.

Competitive Scenario:

Some of the major players operating in global breast imaging technologies market  are, Koninklijke Philips N.V., Fujifilm Holdings Corporation, Gamma Medical Inc., Hologic, Inc., General Electric Company, Siemens AG, TOSHIBA CORPORATION, Sonocine Inc., Aurora Imaging Technology, Inc., Dilon Technologies, Inc., Testo AG, Planmeca OY, Imaging Diagnostic Systems, Inc.

Breast Imaging Technologies Market Report Scope

Report Attribute

Details

Analysis Period

2020–2030

Base Year

2021

Forecast Period

2022–2030

Market Size Estimation

Million (USD)

Growth Rate (CAGR%)

8.4 %

Market Segmentation:

By Technology (Ionizing Breast Imaging Technologies (Mammography (Digital Mammography, 3D Mammogram, and Analog), MBI, PET-CT, PEM), Non-Ionizing Breast Imaging Technologies (Breast Ultrasound, Breast MRI, Automated Whole-Breast Ultrasound, and Breast Thermography)), By End User (Hospitals, Diagnostic Imaging Centers, and Ambulatory Surgical Centers)

Geographical Segmentation

North America (U.S., Canada, Mexico) Europe (UK, Germany, Italy, France, Rest of Europe), Asia-Pacific (China, Japan, India, Australia, Rest of APAC), South America (Brazil, Argentina, Rest of SA), MEA (UAE, Saudi Arabia, South Africa)

Key Companies Profiled

Koninklijke Philips N.V., Fujifilm Holdings Corporation, Gamma Medical Inc., Hologic, Inc., General Electric Company, Siemens AG, TOSHIBA CORPORATION, Sonocine Inc., Aurora Imaging Technology, Inc., Dilon Technologies, Inc., Testo AG, Planmeca OY, Imaging Diagnostic Systems, Inc.


1. INTRODUCTION

1.1.           Report Description

1.2.           Research Methodology

1.2.1               Secondary Research

1.2.2               Primary Research

1.2.3               Data Modelling

1.2.4               Data Triangulation

2. Breast Imaging Technologies Market – Executive Summary

2.1.           Market snapshot, 2018 – 2027, Million usd

3. Market Dynamics

3.1.           Growth Drivers

3.1.1               Raising awareness for breast cancer

3.1.2               Increasing count of cancer patients

3.1.3               Technological advancements

3.2.           Challenges

3.2.1               Strict regulatory approval procedure

3.2.2               Expensive nature of breast cancer detection techniques

3.3.           Opportunities

3.3.1               Scope of growth in emerging economies

4. Global Breast Imaging Technologies Market, By Type

4.1.           Ionizing Breast Imaging Technologies

4.1.1               Global Type Market, By Ionizing Breast Imaging Technologies

4.1.2               Ionizing Breast Imaging Technologies Market, By Region

4.1.2.1          North America Ionizing Breast Imaging Technologies Market, By Country

4.1.2.2          Europe Ionizing Breast Imaging Technologies Market, By Country

4.1.2.3          Asia-Pacific Ionizing Breast Imaging Technologies Market, By Country

4.1.2.4          Rest of World Ionizing Breast Imaging Technologies Market, By Country

4.2.           Non-Ionizing Breast Imaging Technologies

4.2.1               Global Type Market, By Non-Ionizing Breast Imaging Technologies

4.2.2               Non-Ionizing Breast Imaging Technologies Market, By Region

4.2.2.1          North America Non-Ionizing Breast Imaging Technologies Market, By Country

4.2.2.2          Europe Non-Ionizing Breast Imaging Technologies Market, By Country

4.2.2.3          Asia-Pacific Non-Ionizing Breast Imaging Technologies Market, By Country

4.2.2.4          Rest of World Non-Ionizing Breast Imaging Technologies Market, By Country

5. Global Breast Imaging Technologies Market, By Region

5.1.           North America

5.1.1               North America Breast Imaging Technologies Market, By Type

5.1.1.1          North America Type Market, By Ionizing Breast Imaging Technologies

5.1.1.2          North America Type Market, By Non-Ionizing Breast Imaging Technologies

5.1.2               North America Breast Imaging Technologies Market, By Country

5.1.2.1          U.S.

5.1.2.1.1          U.S. Breast Imaging Technologies Market, By Type

5.1.2.1.1.1.      U.S. Type Market, By Ionizing Breast Imaging Technologies

5.1.2.1.1.2.      U.S. Type Market, By Non-Ionizing Breast Imaging Technologies

5.1.2.2          Canada

5.1.2.2.1          Canada Breast Imaging Technologies Market, By Type

5.1.2.2.1.1.      Canada Type Market, By Ionizing Breast Imaging Technologies

5.1.2.2.1.2.      Canada Type Market, By Non-Ionizing Breast Imaging Technologies

5.1.2.3          Mexico

5.1.2.3.1          Mexico Breast Imaging Technologies Market, By Type

5.1.2.3.1.1.      Mexico Type Market, By Ionizing Breast Imaging Technologies

5.1.2.3.1.2.      Mexico Type Market, By Non-Ionizing Breast Imaging Technologies

5.2.           Europe

5.2.1               Europe Breast Imaging Technologies Market, By Type

5.2.1.1          Europe Type Market, By Ionizing Breast Imaging Technologies

5.2.1.2          Europe Type Market, By Non-Ionizing Breast Imaging Technologies

5.2.2               Europe Breast Imaging Technologies Market, By Country

5.2.2.1          Germany

5.2.2.1.1          Germany Breast Imaging Technologies Market, By Type

5.2.2.1.1.1.      Germany Type Market, By Ionizing Breast Imaging Technologies

5.2.2.1.1.2.      Germany Type Market, By Non-Ionizing Breast Imaging Technologies

5.2.2.2          France

5.2.2.2.1          France Breast Imaging Technologies Market, By Type

5.2.2.2.1.1.      France Type Market, By Ionizing Breast Imaging Technologies

5.2.2.2.1.2.      France Type Market, By Non-Ionizing Breast Imaging Technologies

5.2.2.3          UK

5.2.2.3.1          UK Breast Imaging Technologies Market, By Type

5.2.2.3.1.1.      UK Type Market, By Ionizing Breast Imaging Technologies

5.2.2.3.1.2.      UK Type Market, By Non-Ionizing Breast Imaging Technologies

5.2.2.4          Italy

5.2.2.4.1          Italy Breast Imaging Technologies Market, By Type

5.2.2.4.1.1.      Italy Type Market, By Ionizing Breast Imaging Technologies

5.2.2.4.1.2.      Italy Type Market, By Non-Ionizing Breast Imaging Technologies

5.2.2.5          Spain

5.2.2.5.1          Spain Breast Imaging Technologies Market, By Type

5.2.2.5.1.1.      Spain Type Market, By Ionizing Breast Imaging Technologies

5.2.2.5.1.2.      Spain Type Market, By Non-Ionizing Breast Imaging Technologies

5.2.2.6          Rest of Europe

5.2.2.6.1          Rest of Europe Breast Imaging Technologies Market, By Type

5.2.2.6.1.1.      Rest of Europe Type Market, By Ionizing Breast Imaging Technologies

5.2.2.6.1.2.      Rest of Europe Type Market, By Non-Ionizing Breast Imaging Technologies

5.3.           Asia-Pacific

5.3.1               Asia-Pacific Breast Imaging Technologies Market, By Type

5.3.1.1          Asia-Pacific Type Market, By Ionizing Breast Imaging Technologies

5.3.1.2          Asia-Pacific Type Market, By Non-Ionizing Breast Imaging Technologies

5.3.2               Asia-Pacific Breast Imaging Technologies Market, By Country

5.3.2.1          Japan

5.3.2.1.1          Japan Breast Imaging Technologies Market, By Type

5.3.2.1.1.1.      Japan Type Market, By Ionizing Breast Imaging Technologies

5.3.2.1.1.2.      Japan Type Market, By Non-Ionizing Breast Imaging Technologies

5.3.2.2          China

5.3.2.2.1          China Breast Imaging Technologies Market, By Type

5.3.2.2.1.1.      China Type Market, By Ionizing Breast Imaging Technologies

5.3.2.2.1.2.      China Type Market, By Non-Ionizing Breast Imaging Technologies

5.3.2.3          India

5.3.2.3.1          India Breast Imaging Technologies Market, By Type

5.3.2.3.1.1.      India Type Market, By Ionizing Breast Imaging Technologies

5.3.2.3.1.2.      India Type Market, By Non-Ionizing Breast Imaging Technologies

5.3.2.4          Rest of Asia-Pacific

5.3.2.4.1          Rest of Asia-Pacific Breast Imaging Technologies Market, By Type

5.3.2.4.1.1.      Rest of Asia-Pacific Type Market, By Ionizing Breast Imaging Technologies

5.3.2.4.1.2.      Rest of Asia-Pacific Type Market, By Non-Ionizing Breast Imaging Technologies

5.4.           Rest of World

5.4.1               Rest of World Breast Imaging Technologies Market, By Type

5.4.1.1          Rest of World Type Market, By Ionizing Breast Imaging Technologies

5.4.1.2          Rest of World Type Market, By Non-Ionizing Breast Imaging Technologies

5.4.2               Rest of World Breast Imaging Technologies Market, By Country

5.4.2.1          Latin America

5.4.2.1.1          Latin America Breast Imaging Technologies Market, By Type

5.4.2.1.1.1.      Latin America Type Market, By Ionizing Breast Imaging Technologies

5.4.2.1.1.2.      Latin America Type Market, By Non-Ionizing Breast Imaging Technologies

5.4.2.2          Middle East

5.4.2.2.1          Middle East Breast Imaging Technologies Market, By Type

5.4.2.2.1.1.      Middle East Type Market, By Ionizing Breast Imaging Technologies

5.4.2.2.1.2.      Middle East Type Market, By Non-Ionizing Breast Imaging Technologies

5.4.2.3          Africa

5.4.2.3.1          Africa Breast Imaging Technologies Market, By Type

5.4.2.3.1.1.      Africa Type Market, By Ionizing Breast Imaging Technologies

5.4.2.3.1.2.      Africa Type Market, By Non-Ionizing Breast Imaging Technologies

6. COMPANY PROFILES

6.1.           Dilon Technologies, Inc.

6.1.1               Company overview

6.1.2               Company snapshot

6.1.3               Product categories

6.1.4               Strategic moves and developments

6.2.           FUJIFILM holdings Corporation

6.2.1               Company overview

6.2.2               Company snapshot

6.2.3               Operating business segments

6.2.4               Business performance

6.2.5               Strategic moves and developments

6.3.           Gamma Medica, Inc.

6.3.1               Company overview

6.3.2               Company snapshot

6.3.3               Strategic moves and developments

6.4.           General Electric Company

6.4.1               Company overview

6.4.2               Company snapshot

6.4.3               Operating business segments

6.4.4               Business performance

6.4.5               Key strategic moves and developments

6.5.           Hologic, Inc.

6.5.1               Company overview

6.5.2               Company snapshot

6.5.3               Operating business segments

6.5.4               Business performance

6.5.5               Strategic moves and developments

6.6.           koning corporation

6.6.1               Company overview

6.6.2               Company snapshot

6.6.3               Strategic move and developments

6.7.           Koninklijke Philips N.V.

6.7.1               Company overview

6.7.2               Company snapshot

6.7.3               Operating business segments

6.8.           Siemens AG

6.8.1               Company overview

6.8.2               Company snapshot

6.8.3               Operating business segments

6.8.4               Key strategic moves and developments

6.9.           Sonociné, Inc.

6.9.1               Company overview

6.9.2               Company snapshot

6.9.3               Strategic moves and developments

6.10.         Toshiba corporation

6.10.1             Company overview

6.10.2             Company snapshot

6.10.3             Operating business segments


LIST OF TABLE

TABLE 1.          Global Breast Imaging Technologies Market Value, By Type, 2018-2027, Million USD

TABLE 2.          Global Type Market Value, By Ionizing Breast Imaging Technologies, 2018-2027, Million USD

TABLE 3.          Ionizing Breast Imaging Technologies Market Value, By Region, Million USD

TABLE 4.          North America Ionizing Breast Imaging Technologies Market Value, By Country, Million USD

TABLE 5.          Europe Ionizing Breast Imaging Technologies Market Value, By Country, Million USD

TABLE 6.          Asia-Pacific Ionizing Breast Imaging Technologies Market Value, By Country, Million USD

TABLE 7.          Rest of World Ionizing Breast Imaging Technologies Market Value, By Country, Million USD

TABLE 8.          Global Type Market Value, By Non-Ionizing Breast Imaging Technologies, 2018-2027, Million USD

TABLE 9.          Non-Ionizing Breast Imaging Technologies Market Value, By Region, Million USD

TABLE 10.       North America Non-Ionizing Breast Imaging Technologies Market Value, By Country, Million USD

TABLE 11.       Europe Non-Ionizing Breast Imaging Technologies Market Value, By Country, Million USD

TABLE 12.       Asia-Pacific Non-Ionizing Breast Imaging Technologies Market Value, By Country, Million USD

TABLE 13.       Rest of World Non-Ionizing Breast Imaging Technologies Market Value, By Country, Million USD

TABLE 14.       Global Breast Imaging Technologies Market Value, By Region, 2018-2027, Million USD

TABLE 15.       North America Breast Imaging Technologies Market Value, By Type, 2018-2027, Million USD

TABLE 16.       North America Type Market Value, By Ionizing Breast Imaging Technologies, 2018-2027, Million USD

TABLE 17.       North America Type Market Value, By Non-Ionizing Breast Imaging Technologies, 2018-2027, Million USD

TABLE 18.       North America Breast Imaging Technologies Market Value, By Country, 2018-2027, Million USD

TABLE 19.       U.S. Breast Imaging Technologies Market Value, By Type, 2018-2027, Million USD

TABLE 20.       U.S. Type Market Value, By Ionizing Breast Imaging Technologies, 2018-2027, Million USD

TABLE 21.       U.S. Type Market Value, By Non-Ionizing Breast Imaging Technologies, 2018-2027, Million USD

TABLE 22.       Canada Breast Imaging Technologies Market Value, By Type, 2018-2027, Million USD

TABLE 23.       Canada Type Market Value, By Ionizing Breast Imaging Technologies, 2018-2027, Million USD

TABLE 24.       Canada Type Market Value, By Non-Ionizing Breast Imaging Technologies, 2018-2027, Million USD

TABLE 25.       Mexico Breast Imaging Technologies Market Value, By Type, 2018-2027, Million USD

TABLE 26.       Mexico Type Market Value, By Ionizing Breast Imaging Technologies, 2018-2027, Million USD

TABLE 27.       Mexico Type Market Value, By Non-Ionizing Breast Imaging Technologies, 2018-2027, Million USD

TABLE 28.       Europe Breast Imaging Technologies Market Value, By Type, 2018-2027, Million USD

TABLE 29.       Europe Type Market Value, By Ionizing Breast Imaging Technologies, 2018-2027, Million USD

TABLE 30.       Europe Type Market Value, By Non-Ionizing Breast Imaging Technologies, 2018-2027, Million USD

TABLE 31.       Europe Breast Imaging Technologies Market Value, By Country, 2018-2027, Million USD

TABLE 32.       Germany Breast Imaging Technologies Market Value, By Type, 2018-2027, Million USD

TABLE 33.       Germany Type Market Value, By Ionizing Breast Imaging Technologies, 2018-2027, Million USD

TABLE 34.       Germany Type Market Value, By Non-Ionizing Breast Imaging Technologies, 2018-2027, Million USD

TABLE 35.       France Breast Imaging Technologies Market Value, By Type, 2018-2027, Million USD

TABLE 36.       France Type Market Value, By Ionizing Breast Imaging Technologies, 2018-2027, Million USD

TABLE 37.       France Type Market Value, By Non-Ionizing Breast Imaging Technologies, 2018-2027, Million USD

TABLE 38.       UK Breast Imaging Technologies Market Value, By Type, 2018-2027, Million USD

TABLE 39.       UK Type Market Value, By Ionizing Breast Imaging Technologies, 2018-2027, Million USD

TABLE 40.       UK Type Market Value, By Non-Ionizing Breast Imaging Technologies, 2018-2027, Million USD

TABLE 41.       Italy Breast Imaging Technologies Market Value, By Type, 2018-2027, Million USD

TABLE 42.       Italy Type Market Value, By Ionizing Breast Imaging Technologies, 2018-2027, Million USD

TABLE 43.       Italy Type Market Value, By Non-Ionizing Breast Imaging Technologies, 2018-2027, Million USD

TABLE 44.       Spain Breast Imaging Technologies Market Value, By Type, 2018-2027, Million USD

TABLE 45.       Spain Type Market Value, By Ionizing Breast Imaging Technologies, 2018-2027, Million USD

TABLE 46.       Spain Type Market Value, By Non-Ionizing Breast Imaging Technologies, 2018-2027, Million USD

TABLE 47.       Rest of Europe Breast Imaging Technologies Market Value, By Type, 2018-2027, Million USD

TABLE 48.       Rest of Europe Type Market Value, By Ionizing Breast Imaging Technologies, 2018-2027, Million USD

TABLE 49.       Rest of Europe Type Market Value, By Non-Ionizing Breast Imaging Technologies, 2018-2027, Million USD

TABLE 50.       Asia-Pacific Breast Imaging Technologies Market Value, By Type, 2018-2027, Million USD

TABLE 51.       Asia-Pacific Type Market Value, By Ionizing Breast Imaging Technologies, 2018-2027, Million USD

TABLE 52.       Asia-Pacific Type Market Value, By Non-Ionizing Breast Imaging Technologies, 2018-2027, Million USD

TABLE 53.       Asia-Pacific Breast Imaging Technologies Market Value, By Country, 2018-2027, Million USD

TABLE 54.       Japan Breast Imaging Technologies Market Value, By Type, 2018-2027, Million USD

TABLE 55.       Japan Type Market Value, By Ionizing Breast Imaging Technologies, 2018-2027, Million USD

TABLE 56.       Japan Type Market Value, By Non-Ionizing Breast Imaging Technologies, 2018-2027, Million USD

TABLE 57.       China Breast Imaging Technologies Market Value, By Type, 2018-2027, Million USD

TABLE 58.       China Type Market Value, By Ionizing Breast Imaging Technologies, 2018-2027, Million USD

TABLE 59.       China Type Market Value, By Non-Ionizing Breast Imaging Technologies, 2018-2027, Million USD

TABLE 60.       India Breast Imaging Technologies Market Value, By Type, 2018-2027, Million USD

TABLE 61.       India Type Market Value, By Ionizing Breast Imaging Technologies, 2018-2027, Million USD

TABLE 62.       India Type Market Value, By Non-Ionizing Breast Imaging Technologies, 2018-2027, Million USD

TABLE 63.       Rest of Asia-Pacific Breast Imaging Technologies Market Value, By Type, 2018-2027, Million USD

TABLE 64.       Rest of Asia-Pacific Type Market Value, By Ionizing Breast Imaging Technologies, 2018-2027, Million USD

TABLE 65.       Rest of Asia-Pacific Type Market Value, By Non-Ionizing Breast Imaging Technologies, 2018-2027, Million USD

TABLE 66.       Rest of World Breast Imaging Technologies Market Value, By Type, 2018-2027, Million USD

TABLE 67.       Rest of World Type Market Value, By Ionizing Breast Imaging Technologies, 2018-2027, Million USD

TABLE 68.       Rest of World Type Market Value, By Non-Ionizing Breast Imaging Technologies, 2018-2027, Million USD

TABLE 69.       Rest of World Breast Imaging Technologies Market Value, By Country, 2018-2027, Million USD

TABLE 70.       Latin America Breast Imaging Technologies Market Value, By Type, 2018-2027, Million USD

TABLE 71.       Latin America Type Market Value, By Ionizing Breast Imaging Technologies, 2018-2027, Million USD

TABLE 72.       Latin America Type Market Value, By Non-Ionizing Breast Imaging Technologies, 2018-2027, Million USD

TABLE 73.       Middle East Breast Imaging Technologies Market Value, By Type, 2018-2027, Million USD

TABLE 74.       Middle East Type Market Value, By Ionizing Breast Imaging Technologies, 2018-2027, Million USD

TABLE 75.       Middle East Type Market Value, By Non-Ionizing Breast Imaging Technologies, 2018-2027, Million USD

TABLE 76.       Africa Breast Imaging Technologies Market Value, By Type, 2018-2027, Million USD

TABLE 77.       Africa Type Market Value, By Ionizing Breast Imaging Technologies, 2018-2027, Million USD

TABLE 78.       Africa Type Market Value, By Non-Ionizing Breast Imaging Technologies, 2018-2027, Million USD

TABLE 79.       Dilon: company Snapshot

TABLE 80.       Dilon: product categories

TABLE 81.       Fujifilm: company snapshot

TABLE 82.       Fujifilm: operating segments

TABLE 83.       Gamma Medica: company Snapshot

TABLE 84.       ge: Company Snapshot

TABLE 85.       GE: operating segments

TABLE 86.       hologic: company Snapshot

TABLE 87.       hologic: Operating business segments

TABLE 88.       koning: company Snapshot

TABLE 89.       Philips: company snapshot

TABLE 90.       PHILIPS: OPERATING segments

TABLE 91.       Siemens: Company snapshot

TABLE 92.       Siemens: operating segments

TABLE 93.       Sonociné: company Snapshot

TABLE 94.       toshiba: company snapshot

TABLE 95.       toshiba: operating segments


LIST OF FIGURES

FIGURE 1.       Research Methodology

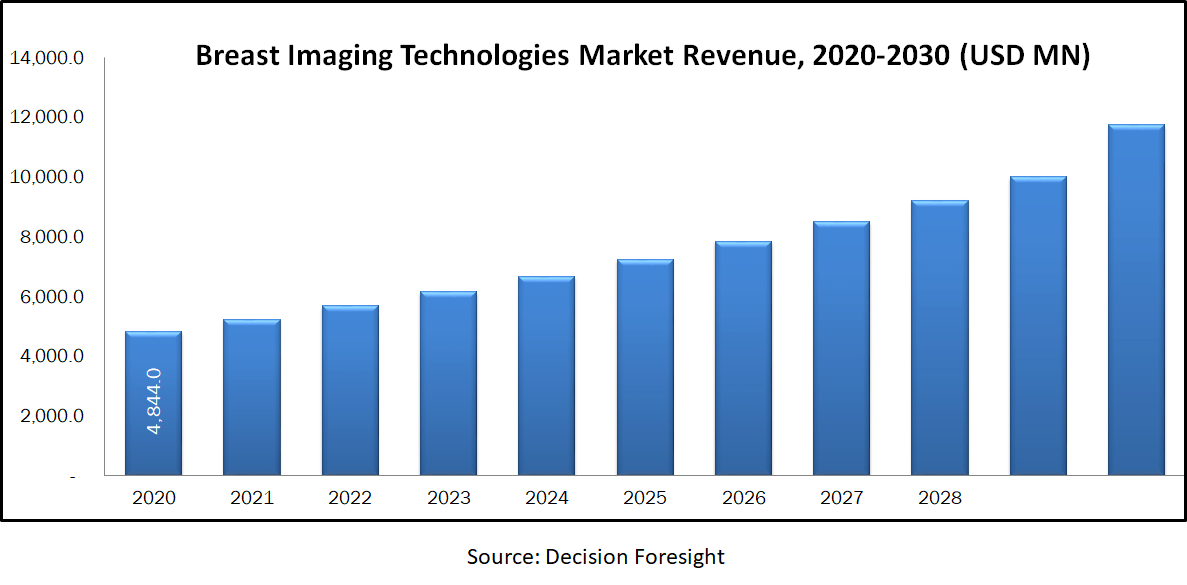
FIGURE 2.       Global Breast Imaging Technologies Market Value, By Type, 2018-2027, Million USD

FIGURE 3.       Global Type Market Value, By Ionizing Breast Imaging Technologies, 2018-2027, Million USD

FIGURE 4.       Ionizing Breast Imaging Technologies Market Value, By Region, Million USD

FIGURE 5.       North America Ionizing Breast Imaging Technologies Market Value, By Country, Million USD

FIGURE 6.       Europe Ionizing Breast Imaging Technologies Market Value, By Country, Million USD

FIGURE 7.       Asia-Pacific Ionizing Breast Imaging Technologies Market Value, By Country, Million USD

FIGURE 8.       Rest of World Ionizing Breast Imaging Technologies Market Value, By Country, Million USD

FIGURE 9.       Global Type Market Value, By Non-Ionizing Breast Imaging Technologies, 2018-2027, Million USD

FIGURE 10.    Non-Ionizing Breast Imaging Technologies Market Value, By Region, Million USD

FIGURE 11.    North America Non-Ionizing Breast Imaging Technologies Market Value, By Country, Million USD

FIGURE 12.    Europe Non-Ionizing Breast Imaging Technologies Market Value, By Country, Million USD

FIGURE 13.    Asia-Pacific Non-Ionizing Breast Imaging Technologies Market Value, By Country, Million USD

FIGURE 14.    Rest of World Non-Ionizing Breast Imaging Technologies Market Value, By Country, Million USD

FIGURE 15.    Global Breast Imaging Technologies Market Value, By Region, 2018-2027, Million USD

FIGURE 16.    North America Breast Imaging Technologies Market Value, By Type, 2018-2027, Million USD

FIGURE 17.    North America Type Market Value, By Ionizing Breast Imaging Technologies, 2018-2027, Million USD

FIGURE 18.    North America Type Market Value, By Non-Ionizing Breast Imaging Technologies, 2018-2027, Million USD

FIGURE 19.    North America Breast Imaging Technologies Market Value, By Country, 2018-2027, Million USD

FIGURE 20.    U.S. Breast Imaging Technologies Market Value, By Type, 2018-2027, Million USD

FIGURE 21.    U.S. Type Market Value, By Ionizing Breast Imaging Technologies, 2018-2027, Million USD

FIGURE 22.    U.S. Type Market Value, By Non-Ionizing Breast Imaging Technologies, 2018-2027, Million USD

FIGURE 23.    Canada Breast Imaging Technologies Market Value, By Type, 2018-2027, Million USD

FIGURE 24.    Canada Type Market Value, By Ionizing Breast Imaging Technologies, 2018-2027, Million USD

FIGURE 25.    Canada Type Market Value, By Non-Ionizing Breast Imaging Technologies, 2018-2027, Million USD

FIGURE 26.    Mexico Breast Imaging Technologies Market Value, By Type, 2018-2027, Million USD

FIGURE 27.    Mexico Type Market Value, By Ionizing Breast Imaging Technologies, 2018-2027, Million USD

FIGURE 28.    Mexico Type Market Value, By Non-Ionizing Breast Imaging Technologies, 2018-2027, Million USD

FIGURE 29.    Europe Breast Imaging Technologies Market Value, By Type, 2018-2027, Million USD

FIGURE 30.    Europe Type Market Value, By Ionizing Breast Imaging Technologies, 2018-2027, Million USD

FIGURE 31.    Europe Type Market Value, By Non-Ionizing Breast Imaging Technologies, 2018-2027, Million USD

FIGURE 32.    Europe Breast Imaging Technologies Market Value, By Country, 2018-2027, Million USD

FIGURE 33.    Germany Breast Imaging Technologies Market Value, By Type, 2018-2027, Million USD

FIGURE 34.    Germany Type Market Value, By Ionizing Breast Imaging Technologies, 2018-2027, Million USD

FIGURE 35.    Germany Type Market Value, By Non-Ionizing Breast Imaging Technologies, 2018-2027, Million USD

FIGURE 36.    France Breast Imaging Technologies Market Value, By Type, 2018-2027, Million USD

FIGURE 37.    France Type Market Value, By Ionizing Breast Imaging Technologies, 2018-2027, Million USD

FIGURE 38.    France Type Market Value, By Non-Ionizing Breast Imaging Technologies, 2018-2027, Million USD

FIGURE 39.    UK Breast Imaging Technologies Market Value, By Type, 2018-2027, Million USD

FIGURE 40.    UK Type Market Value, By Ionizing Breast Imaging Technologies, 2018-2027, Million USD

FIGURE 41.    UK Type Market Value, By Non-Ionizing Breast Imaging Technologies, 2018-2027, Million USD

FIGURE 42.    Italy Breast Imaging Technologies Market Value, By Type, 2018-2027, Million USD

FIGURE 43.    Italy Type Market Value, By Ionizing Breast Imaging Technologies, 2018-2027, Million USD

FIGURE 44.    Italy Type Market Value, By Non-Ionizing Breast Imaging Technologies, 2018-2027, Million USD

FIGURE 45.    Spain Breast Imaging Technologies Market Value, By Type, 2018-2027, Million USD

FIGURE 46.    Spain Type Market Value, By Ionizing Breast Imaging Technologies, 2018-2027, Million USD

FIGURE 47.    Spain Type Market Value, By Non-Ionizing Breast Imaging Technologies, 2018-2027, Million USD

FIGURE 48.    Rest of Europe Breast Imaging Technologies Market Value, By Type, 2018-2027, Million USD

FIGURE 49.    Rest of Europe Type Market Value, By Ionizing Breast Imaging Technologies, 2018-2027, Million USD

FIGURE 50.    Rest of Europe Type Market Value, By Non-Ionizing Breast Imaging Technologies, 2018-2027, Million USD

FIGURE 51.    Asia-Pacific Breast Imaging Technologies Market Value, By Type, 2018-2027, Million USD

FIGURE 52.    Asia-Pacific Type Market Value, By Ionizing Breast Imaging Technologies, 2018-2027, Million USD

FIGURE 53.    Asia-Pacific Type Market Value, By Non-Ionizing Breast Imaging Technologies, 2018-2027, Million USD

FIGURE 54.    Asia-Pacific Breast Imaging Technologies Market Value, By Country, 2018-2027, Million USD

FIGURE 55.    Japan Breast Imaging Technologies Market Value, By Type, 2018-2027, Million USD

FIGURE 56.    Japan Type Market Value, By Ionizing Breast Imaging Technologies, 2018-2027, Million USD

FIGURE 57.    Japan Type Market Value, By Non-Ionizing Breast Imaging Technologies, 2018-2027, Million USD

FIGURE 58.    China Breast Imaging Technologies Market Value, By Type, 2018-2027, Million USD

FIGURE 59.    China Type Market Value, By Ionizing Breast Imaging Technologies, 2018-2027, Million USD

FIGURE 60.    China Type Market Value, By Non-Ionizing Breast Imaging Technologies, 2018-2027, Million USD

FIGURE 61.    India Breast Imaging Technologies Market Value, By Type, 2018-2027, Million USD

FIGURE 62.    India Type Market Value, By Ionizing Breast Imaging Technologies, 2018-2027, Million USD

FIGURE 63.    India Type Market Value, By Non-Ionizing Breast Imaging Technologies, 2018-2027, Million USD

FIGURE 64.    Rest of Asia-Pacific Breast Imaging Technologies Market Value, By Type, 2018-2027, Million USD

FIGURE 65.    Rest of Asia-Pacific Type Market Value, By Ionizing Breast Imaging Technologies, 2018-2027, Million USD

FIGURE 66.    Rest of Asia-Pacific Type Market Value, By Non-Ionizing Breast Imaging Technologies, 2018-2027, Million USD

FIGURE 67.    Rest of World Breast Imaging Technologies Market Value, By Type, 2018-2027, Million USD

FIGURE 68.    Rest of World Type Market Value, By Ionizing Breast Imaging Technologies, 2018-2027, Million USD

FIGURE 69.    Rest of World Type Market Value, By Non-Ionizing Breast Imaging Technologies, 2018-2027, Million USD

FIGURE 70.    Rest of World Breast Imaging Technologies Market Value, By Country, 2018-2027, Million USD

FIGURE 71.    Latin America Breast Imaging Technologies Market Value, By Type, 2018-2027, Million USD

FIGURE 72.    Latin America Type Market Value, By Ionizing Breast Imaging Technologies, 2018-2027, Million USD

FIGURE 73.    Latin America Type Market Value, By Non-Ionizing Breast Imaging Technologies, 2018-2027, Million USD

FIGURE 74.    Middle East Breast Imaging Technologies Market Value, By Type, 2018-2027, Million USD

FIGURE 75.    Middle East Type Market Value, By Ionizing Breast Imaging Technologies, 2018-2027, Million USD

FIGURE 76.    Middle East Type Market Value, By Non-Ionizing Breast Imaging Technologies, 2018-2027, Million USD

FIGURE 77.    Africa Breast Imaging Technologies Market Value, By Type, 2018-2027, Million USD

FIGURE 78.    Africa Type Market Value, By Ionizing Breast Imaging Technologies, 2018-2027, Million USD

FIGURE 79.    Africa Type Market Value, By Non-Ionizing Breast Imaging Technologies, 2018-2027, Million USD

FIGURE 80.    fujifilm: financials

FIGURE 81.    GE: financials

FIGURE 82.    hologic: financials ($million)


KEY PLAYERS
o    Koninklijke Philips N.V.
o    Fujifilm Holdings Corporation
o    Gamma Medical Inc.
o    Hologic, Inc.
o    General Electric Company
o    Siemens AG
o    TOSHIBA CORPORATION, 
o    Sonocine Inc.
o    Aurora Imaging Technology, Inc.
o    Dilon Technologies, Inc.
o    Testo AG
o    Planmeca OY
o    Imaging Diagnostic Systems, Inc.


©2024 Decision Foresight. All Rights Reserved.